COFFEE
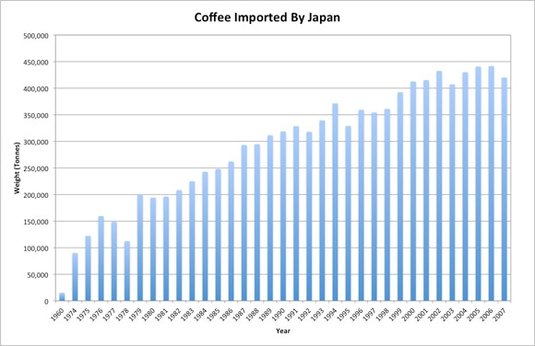
I chose this graph because I find extremely interesting how the industry of coffee around the world has developed so drastically in such short amount of time most of the times. We seem to forget the evidence of this phenomenon, especially in Japan. Taking in consideration that coffee is the second most traded commodity, is no surprise that countries around the world has increased the amount of coffee being exported from and to different parts of the world . As the graph shows , Japan imported millions of tons of coffee over the last decades.
As a result of the bloom in the coffee industry over the last decades, today we can chose and enjoy from a wide variety of coffee beans and different method of brewing coffee not only in New York but around the World.
|
1 - The amount of coffee imported by Japan increased by 80,000 tons from 1960 to 1974.
2-The amount of coffee imported by Japan steadily increased from 1974 to 1976. 3-The amount of coffee imported by Japan decreased to 110,000 tons in 1978. 4-The amount of coffee imported by Japan increased from 1979 to 1994. 5-The amount of coffee imported by Japan dropped to from 370,000 tons to 330,000 tons in 1995. 6-The amount of coffee imported by Japan roughly stayed the same between 1996 and 1998. 7-The amount of coffee imported by Japan doubled from 200,000 tons to 400.000 tons between 1979 and 2003. 8- The amount of coffee imported by Japan increased by 30,000 tons between 2003 and 2006. 9-The amount of coffee imported by Japan decreased by 20,000 in 2007 10- The amount of coffee imported by Japan has increased 8 times since 1960. |
